What is Bacterial Growth Curve?
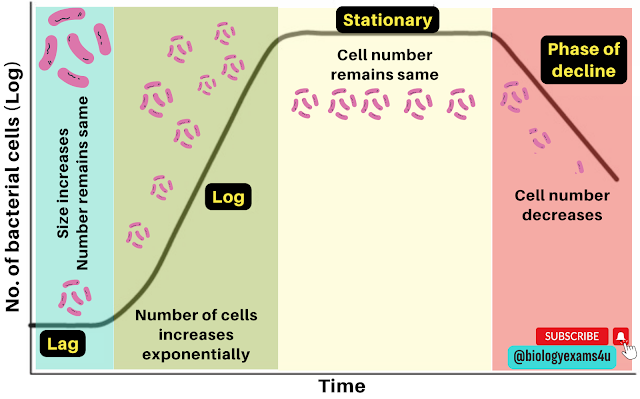
The bacterial growth curve is a graphical representation that shows the number of live cells in a bacterial population over a period of time when cultured in a liquid medium. On counting the number of bacteria at regular intervals, four distict phases can be observed.
Lag Phase: In lag phase, there is no increase in the number of bacteria, but bacterial cell size may increase.- The bacterial will be metabolically active and is adapting to their new environment. The duration of lag phase varies with the species of bacteria, size of inoculum, nature of culture medium and environmental factors such as temperature.
- The maximum size of the bacterial cells is obtained at the end of the lag phase.
Second phase is the log phase or the exponential phase.
- In this phase, bacterial cells starts dividing and their numbers increase with time exponentially.
- In this phase, cells are smaller and stain uniformly. Bacteria are more susceptible to antibiotics during log phase.
Third phase is the stationary phase.
- In this phase, bacterial cell division stops due to the depletion of nutrients and accumulation of toxic products.
- The new cells and the dyeing cells remains same. Some bacteria undergo sporulation and some others produce secondary metabolites such as exotoxins or antibiotics during this stage.
Final stage is the phase of decline or Death phase.
- In this phase bacterial population decreases due to cell death caused by nutritional depletion, toxin accumulation and also induced by the presence of autolytic enzymes.

